Liberty Sirius (LSXMA/K)

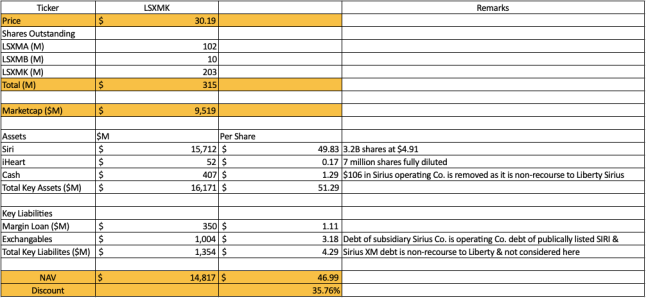
Liberty Sirius closed at $30.19 / share on March 27th. Its main asset is 3.2B shares of publicly traded Sirius XM (SIRI). Since the start of the year, the  discount between SIRI and LSXMK has increased by close to 9 pts. (Courtesy: Yahoo Finance) Given the fact that LSXMK was trading at a discount at the beginning of the year, it is worthwhile to see the NAV discount that LSXMK is trading at.

Screenshot 2020-03-28 at 12.15.03 PM

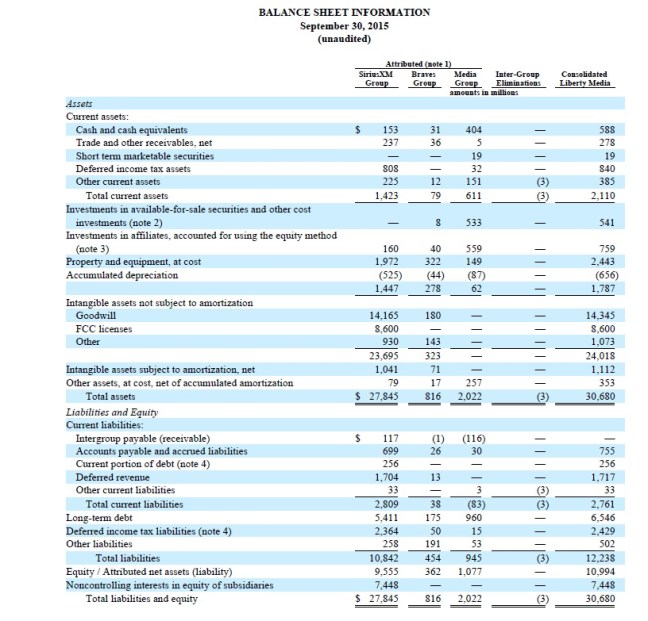
The key to note before we dive into the NAV calculation is that LSXMK financials consolidates SIRI as it holds over 71% of the shares outstanding. This is from an accounting perspective. In reality though, SIRI operates as a separate public listed company and the debt / cash are non-recourse at this point to Liberty Sirius Group or the Liberty Media group. The other way to think about it, the debt and the cash held at SIRI is at an operating company level.

Taking that into consideration, the NAV calculation shows a significant discount to the underlying asset which can be valued using market listed securities.

Screenshot 2020-03-28 at 12.24.38 PM

There are four possibilities that could cause the discounts to be significant.

  1. The market is treating the SIRI debt as recourse to LSXMK and the given the higher level of debt at SIRI and deteriorating market conditions is discounting LSXMK further. This makes no sense because if that were the case, SIRI should be falling as well. Furthermore, SIRI’s FCF is good and the debt is at operating company level. This was shown clearly at the annual meeting. Furthermore, the churn during the last recession was actually much lower than people expect. It was in low single digit %.
  2. The market is assuming that given the drop in stock price, John Malone might pay a premium to buy Sirius completely. Given the disciplined nature of M&A that the Liberty complex has exhibited so far, that seems improbable.
  3. Ability to roll over debt in the near term (nothing alarming there)
  4. Since LSXMK is a tracking stock, the market has increased the discount considering the possibility of liquidation of entire Liberty Media complex with a deterioration for FWONK and BATRK.  Currently, there is nothing that indicates that FWONK or BATRK is impacted to the point of liquidation that will demand a 35% haircut on NAV of LSXMK.

It seems to be a case of the market discounting tracking stocks in general a lot higher in this environment. Time will tell.

Any comments on what I could be missing is welcome. contact@beowulfcap.com

Disclosure: Long SIRI and action expected in Liberty Sirius


Screenshot 2020-03-28 at 9.35.31 AM

Advertisement

GCI Liberty: Thoughts!

I have been looking at various securities this weekend to work on what is finally turning out to be an idea-rich environment. GCI Liberty, the sole cable provider in Alaska, was an interesting company to look at given that it belongs to the Malone complex. Amongst the dozens of securities and tracking stocks that the Liberty empire has, GLIBP (GCI Liberty Preferred) and GLIBA (GCI Liberty Common A) are two such securities.

GCI Liberty has always traded at a discount to the underlying Liberty broadband and Charter shares. I wanted to do a quick back of the envelope NAV calculation to see the level of discount and whether it would interest me among all the other opportunities on hand. Unfortunately, the discount using a fairly conservative approach turned out to be close to 20% and not much higher that I was expecting. Please note that the below NAV calculation aims to capture only the key components and is a rough guesstimate of the NAV.

Screenshot 2020-03-23 at 5.12.43 PM

However, the cumulative, non-convertible preferred stock trading at $22.25 with a 7% coupon (payable in 4 quarterly payments) with a $25 liquidation value callable after 2021 with a yield of 8.71% is mildly more interesting play with the common equity providing the cushion required for the dividend payments.

Update: To reflect the cash on the balance sheet. Thanks to Rocco for pointing it out.

What are we reading?

  1. Charter executive questions 5G (here)
  2. Dawn of 5G: Will wireless kill the broadband star? (here)
  3. Here’s why your cable company wants to be your wireless provider (here)
  4. Charter tests 5G in six cities (here)
  5. T-Mobile calls Comcast irrelevant but results disagree (here)
  6. John Malone thinks cable and wireless are destined to consolidate (here) — dated post
  7. Liberty Global quietly reshapes its 5G strategy (here)
  8. Why the US cable industry is poised for recovery (here)
  9. Case for cable (here)
  10. Charter looks beyond MVNO and prepares to launch wireless next year (here)
  11. Charter is testing 6G Wireless (here)

Discovery Communications (DISCK/A)

It has only been 25 short days since we published our blog on Discovery (here) Few things have happened since then. Discovery is up 26% since then. Not that the short term vindicates the thesis. It just indicates how dirt cheap DISCK was at one point.

Screen Shot 2017-12-20 at 6.58.51 AM

This was necessarily driven by two things: a. John Malone talking about it here

b. John Malone putting his money where his mouth his here.

Will be interesting to watch what happens with DISCK/A.

Disclosure: Own DISCK.


Discovery Communications

Note: I have used a lot of approx. calculations as a proxy to quickly look through DISCA/K’s numbers.

Discovery Communications (DISC(A/K)) entered into a merger agreement with Scripps Networks on July 31st, 2017. Discovery will pay $90/share to Scripps shareholders in a combination of cash and stock. The transaction is expected to close in Q1 2018.   Below outlines the transaction details on how Scripps SH will get paid.

Screenshot from 2017-11-26 18-12-52

Furthermore, the amount of Discovery stock that Scripps will get paid depends on the 15 day VWAP of Discovery shares before the close.

Screenshot from 2017-11-26 18-18-17.png

Essentially, if the 15 day VWAP is less than $22.32, Scrips SH will get paid 1.2096 shares of DISCK; if 15 day VWAP of DISCK > $28.70, then 0.9408; if 15 day VWAP of DISCK between $22.32 & $28.7, then it will be the 15 day VWAP averaging to $27.

The strategic rationale explained by Discovery for the acquisition was to create a scaled up independent media company. Discovery will own 0.3M hours of programmable content with 8K hours being produced annually between the two networks. The potential for Scripps to grow outside the US will provide top line synergies while the cost synergies are expected to be around $350M annually. The two companies together will account of 20% of ad supported paid TV network in the US.

The combined network of discovery and Scripps is shown below.

Screenshot from 2017-11-26 18-31-31.png

Top line & bottom line synergies are shown below:

Screenshot from 2017-11-26 18-34-00

Screenshot from 2017-11-26 18-34-57

Since the acquisition has been announced, DISCK has been on a slide clearly indicating the market’s reaction to the deal and the fact that Discovery is losing subscribers at the rate of 3% a year and 5% in the recent quarter driven by its smaller network. The Scripps deal will give it faster access to the skinny bundles / OTT as shown here by Bloomberg. (Article link here)

Screenshot from 2017-11-26 18-37-33

The stock is in doldrums crashing to low of $15/share and currently trading at $16.46/share. DISCK was trading close to $26/share at the time of the announcement of the merger.

The key reason behind this crash seems to be the suspension of buybacks in order to fund the merger, dilution, higher indebtedness and the industry fears of cord cutting and Discovery’s move to double down on the pay TV video model.

So, how does DISCK plan to pay for the $63/share to Scripps shareholders?

Screenshot from 2017-11-26 18-43-30.png

Screenshot from 2017-11-26 18-43-53

Screenshot from 2017-11-26 19-04-11

The additional $8.6B meant that DISCK has to suspend buybacks till it pared down debt to manageable proportions (3.5X OIBDA as stated during the transaction). The expected leverage at the time of closing is 4.8X. Going by the playbook of John Malone, at 3.5X, it will be a debt that will stay on the books forever and then the buybacks will start again. Before they start buying back stock, Discovery will have to retire $6B+ worth of debt.

Let us take a look at how the two companies put together look like (using full year 2016 numbers)

Screenshot from 2017-11-26 19-16-26.png

At first glance, one would wonder why would you put together two companies that are making $1.8B/year separately into a merger to generate $1.0B?

A closer look reveals that combined NI is $1.06B. Because of the huge premium paid, the D&A will shoot up. This is part of the price being paid to acquire intangible assets of Scripps and will be amortized.  When you look at Capex for Discovery and Scripps, combined they do not spend more than $200M.

NI + D&A – Capex = $1.06B + $1.57B – $0.2B = $2.4B over 770 million SOS. A good proxy for owner’s earnings.  See below tables for calculation on the SOS.

Screenshot from 2017-11-26 19-22-00

So what happens to the increased debt and taxes? Interest expense goes up and taxes come down. The additional debt is at weighted average of 3.6% and additional $316M of interest expense is offset by $506M of income tax savings. If there is further reduction in the tax rate, that would be an additional cherry on the top. Further, the cost synergies of $350M will translate to approx. $100M in year 1 and approx. $200M post tax dollars starting year 2 and drive both cash flow and the NI to grow.

$2.4B + OIBDA Growth (Assume 10% year year initial two years from sales synergies) + Cost synergies growth ($100 1st year, $200 second year), Discovery & Scripps combined will generate $2.7B and $3.2B in year 1 and 2 or $9.5B in first 36 months.

At 770 M shares (post dilution) at $17/share, the market is valuing Discovery at $13B or at 5.5 times owner’s earnings. The market has priced Discovery for failure. If they succeed in realizing the synergies, it will be a blockbuster stock. If they manage okay with the integration, it will still be a great bet with acceptable returns.

Even though Discovery is losing subscribers, it is growing its OIBDA every year and with the Scripps merger,  it will greater access to the OTT market. Discovery’s international platform will also benefit Scripps. Currently, the market is pricing Discovery Communications to be dead in the water.  It will be interesting to see how this plays out.

Disclosure: Not to be taken as investment recommendation. Might trade in DISCA/K

Sources for this post: S-4 Form, Merger Presentation, 10-Q’s


TRIP owned by Allan Mecham

Very interesting to see that Allan Mecham of Arlington value capital has been buying TRIP. See articles related to Allan Mecham here.

See our post on Trip Advisor here.

Period Shares % of Portfolio Activity % Change to Portfolio Reported Price
2015   Q4 324,040 3.48 Add 109.89% 1.82 $85.25
2015   Q3 154,389 1.31 Buy 1.31 $63.02

Source: dataroma.com

Trip Advisor and Liberty Trip Advisor (TRIP & LTRPA/B)

Trip Advisor is an online travel booking website that operates in the crowded and competitive online travel segment. It operates mainly through tripadvisor.com and its variants.

The market size for travel spending is about $1.3T annually and is growing. Close to 40% or $500B of this spend happens online through services provided by OTA’s like flight, hotel and car bookings.  Key players include Priceline.com, expedia.com and their affiliated websites and meta-search players like kayak.com, trivago.com etc.  The business models for OTA’s are pretty simple a. Attract users on the website b. Offer the best rates and get users to book the room / flight / car  c. Get a commission from the hotels and use a part of it to market the website and 4. Repeat cycle. OTA’s are a high growth, high margin, high ROIC businesses.

For example: Priceline with its flagship priceline.com and booking.com . Priceline has a market cap of $66B and a PE of 27 and is richly valued.

In Millions of USD

2015 2014 2013 2012 2012-2015 CAGR
Revenue 9,223.99 8,441.97 6,793.31 5,260.96 20.4%
Gross Profit 8,591.81 7,584.13 5,715.89 4,083.68 27.8%
Selling/General/Admin. Expenses, Total 5,060.41 4,303.00 3,185.50 2,188.75 31.9%
Net Income 2,551.36 2,421.75 1,892.66 1,419.57 21.3%
Net Income % 27.7% 28.7% 27.9% 27.0%
Total Equity 8,795.47 8,566.69 6,909.73 3,896.97 30.8%
Long Term Debt 6,158.44 3,824.20 1,750.58 936.65 86.2%
ROE % 29.0% 28.3% 27.4% 36.4%

Example two would be Expedia which primarily derives its revenue from the large US market. It mainly operates through hotels.com, Orbitz and expedia.com. Expedia is trading at 19 times earnings and TripAdvisor was a spin off from Expedia in 2011. Also, it has John Malone’s fingerprints all over it through its 18% stake that is being spun off through Liberty Expedia (a post for another day)

In Millions of USD

2015 2014 2013 2012 2012-2015 CAGR
Revenue 6,672.32 5,763.48 4,771.26 4,030.35 18.1%
Gross Profit 5,362.76 4,584.40 3,733.22 3,131.74 19.4%
Selling/General/Admin. Expenses, Total 3,955.00 3,233.70 2,573.22 2,066.39 23.9%
Net Income 764.47 398.1 232.85 280.17
Net Income % 11.5% 6.9% 4.9% 7.0%
Total Equity 4,864.39 1,784.27 2,145.46 2,280.26 28.4%
Total Long Term Debt 3,201.28 1,746.79 1,249.41 1,249.35 36.4%
ROE % 15.7% 22.3% 10.9% 12.3%

What is Trip Advisor’s beef in this space?

Trip Advisor has an annual revenue of about $1.5B and is a growing business. TRIP has a rich base of user content and reviews that makes the site an ideal one-stop shop for travel planning. It currently has around 1.8M accommodations, 3.8M restaurants and 600K+ attractions that can be researched and planned on its website. It attracts over 350M unique visitors every month and has over 300M reviews on its sites. No other website can provide the breadth and depth of content and research that TRIP does today. This content is similar to how Amazon reviews drives traffic for Amazon. TRIP is also available in 46 languages making it accessible globally.  (All data are from its 2015 annual report)

When users research and plan trips through its website, one can search for hotels using Trip Advisor’s meta search and price compare with all other websites and book the best option available for the user. TRIP then takes a cut from the OTA (Priceline, Expedia) and the commissions thus derived are the major source of revenue today for TRIP.

In Millions of USD 2015 2014 2013 2012 2012-2015 CAGR
Revenue 1,492 1,246 945 763 24.8%
Gross Profit 1,434 1,206 927 751 23.8%
Selling/General/Admin. Expenses, Total 1,109 797 597 429 36.8%
Net Income 198 226 205 194 0.7%
Net Income % 13.3% 18.1% 21.7% 25.4%
Total Equity 1,412 1,125 865 727 24.5%
Total Long Term Debt 200 259 300 340 -16.1%
ROE % 14.0% 20.1% 23.7% 26.7%

TRIP through its huge user generated content has been attracting a lot of users and has been growing at a good clip. However, TRIP get a cut of the OTA’s commission that the hotels pay the OTA for directing traffic. So, TRIP is a marketing spend for OTA’s to attract  users.

Recently, TRIP has also been investing heavily in its business to enter the OTA business itself. Currently, one can book hotels directly on TRIP without having to leave its website. Over time, the company believes that it will reap rewards for this feature. However, in the short term, it has depressed margins. Furthermore, as seen through Priceline and Expedia, the margins in the OTA space are mouthwatering. If TripAdvisor is successful in entering the OTA space, its past growth and margins will not be a good indicator for the future. It must also be noted that PriceLine and Expedia are also getting into the content ranking space for hotels etc. in order to intensify competition with TRIP.

Today, TRIP can definitely be counted to create value to end users for their travel planning needs. The bigger question is can TRIP appropriate the value in the process? After researching, users are usually looking for the cheapest available room at a selected hotel. At the risk of being biased through personal experience and of those around me, today almost everyone uses TRIP for planning. However, when it comes to booking, there is almost always a cheaper option available (5-10%) than found on TRIP’s site or any of the other links that it provides. This is the significant difference between Amazon and TRIP. On Amazon, one is almost guaranteed to get the cheapest price for things. In the case of TRIP, there are significant discounts available today through mobile apps that take the price way below the advertised price on TRIP (mobile or website) with a very reasonable investment of a few minutes. How long will this continue is a question but it is possible that it is preventing TRIP from appropriating value from what it is creating.  It is creating a ceiling for the booking process than the floor and that is a significant problem that TRIP has to address quickly  if it needs to be competitive long term.

Valuation:

Currently TRIP is valued at $9B at a PE close to 47. However, this company has fingerprints of John Malone / George Maffei all over it with their 21% economic interest and 56% voting interest. Going by John Malone’s play book, free cash flow might be a better indicator of value for TRIP. TRIP generated around $873M of free cash flow in the last three years making its FCF yield at close to 3% of market cap per year. The Malone play book of levered buybacks, rising debt to be at an acceptable multiple of EBITDA, delaying the taxman’s liabilities are yet to play out at TRIP. Even with all the above unexplored levers and its foray into the OTA space, TRIP is richly valued today at 3% FCF yield and is not a slam dunk investment in our opinion.

Liberty Trip Advisor holdings (LTRPA/B) owns about ~31M shares in TRIP valued at $1.9B. The market cap of LTRPA is $1.6B at a 15% discount to TRIP. (LTRPA is trading at a premium as it has a $400M margin loan on LTRPA and LTRPA at this point does not have access to the cash flows of TRIP) However, it is a holding company with the money losing buyseasons business. LTRPA is designed to be a tax free way for TRIP (TRIP buying LTRPA will not be tax free) or other OTA’s to buy TRIP through LTRPA. In other words, LTRPA is a vehicle for John Malone to cash out on TRIP in a tax free manner. In August 201(7)6, LTRPA would complete two years enabling it to make tax free swaps with other entities (another leaf from John Malone’s playbook)

Disclosure: No Position

Liberty Media Corp. Tracking Stocks

During the shareholders meeting in November, Liberty Media announced that it would create three tracking stocks for its Liberty Media stock. Liberty has filed its 388 page registration prospectus here

As per this registration document, Liberty Media will have three tracking stocks, Liberty Sirius group, Liberty Braves Group and Liberty Media group. In typical Malone style, each of these stocks will have three series of stocks, A, C and the super voting B shares that will largely be held by John Malone and his insiders. Essentially,  LMCA, LMCB and LMCK will cease to exist and will be replaced by 9 tracking stocks — LSXMA, LSXMB, LSXMK for the Liberty Sirius group; BATRA, BATRB, BATRK for the Liberty Braves group and LMCA, LMCB and LMCK for the remaining Liberty Media group. BATRB and LMCB will trade on OTC and the rest will trade on NASDAQ.

Each shareholder of one Liberty Media common stock will now receive one share of Liberty Sirius group, 0.1 share of Liberty Braves and 0.25 shares of Liberty Media stock. Each shareholder of of Liberty common stock will get new stocks in the corresponding series. For example: LMCA holder will get BATRA, LSXMA and LMCA etc. Furthermore, A series will have one vote per share, B shares will have 10 votes per share and C series of the three families will have no votes unless otherwise required by Delaware law (For Example: Liquidation of the parent Liberty company). Economic exposure will be the same for all three classes. However, there is always a possibility that the B class super voting shares might be taken out at a premium (it exists today as well). No fractional shares will be provided and shareholders will get paid in cash (taxable) in lieu of fractional shares.John Malone will continue to be a 10%+ economic owner with 47.7% of aggregate voting power in the newly formed companies through his B series shares.

In this tracking stock proposal, the holders of the securities can track the performance of the individual segment and can own the stock of the separate segments. However, these are tracking stocks and the shareholders will have no claim over the assets of the tracking stocks and will still be exposed to Liberty Media as a whole. However, the shareholders can mix the proportion of economic exposure they get to the three segments in the event of a buyout of the individual segment. Shareholders will ultimately have to be dependent on the board of directors of Liberty Media to maximize shareholder’s value which John Malone and his lieutenants seems to have a good track record for.

A few key things to keep in mind. Liberty can dispose any of the three groups of stocks (Sirius, Braves or Media stocks) without further shareholder approval. If any of the groups are taken over in a M&A, then under the new charter, the company will either pay a dividend, redeem the common for cash or securities or convert all the existing shares into a different security. Here’s the kicker, if Liberty Media were liquidated as a whole, shareholders of different stocks will get paid on the proportionate ‘liquidation units’  determined by the first twenty days trading prices of the three classes of stocks (Sirius, Braves and Media) If an enterprising investor were to need exposure to the possibility of Liberty Media being liquidated as a whole, post the first 20 days, one can pick the tracking stock that will give the highest exposure.

Liberty Sirius group will have the 60%+ interest in Sirius corporation. In addition, it will have a $250M margin loan secured by Sirius shares and $50M cash and deferred tax liabilities.

Liberty Braves group will have assets attributed with the Atlanta Braves team. It will have $61M in cash and $165M in loans by Braves holdings. Further more, Braves will have a rights offering for $200M allowing shareholders to purchase C class shares at 20% discount to prevailing market price.

Liberty Media group will own 34% in Live Nation, $420M after tax proceeds from Vivendi settlement, some public securities in Time Warner, Viacom etc, $50M in cash and 1.375% cash convertible senior notes due 2023 of $1B with the relevant warrant and bond hedges. It will also own a 20% interest in Liberty Braves.

Below are the attributable Assets, Income and Cash Flows to the three units as of Sep 30, 2015.

Liberty_Balance_SheetIncome_StatementLiberty_Cash_FlowsLiberty_AFS

All these complexity comes at a cost. Tracking units are not standalone entities. If Liberty Media were to be liquidated as a whole company, your exposure and proceeds may not be necessarily connected with the attributed assets and liabilities. Even while owning a single family of tracking stocks, an investor might be exposed to the risks associated with the whole company or risk associated with a different family of tracking stock. Liberty is trying to unlock the complexity discount, ‘Liberty might overpay for Sirius’ discount and the sum of the parts discount that the stock holds today and it is not very clear how this will help reduce those concerns. However, it will give a deeper insight into the functioning and returns at a more granular level. Liberty’s contention is that tracking stocks would reduce the sum-of-the-parts being lesser than the whole discount remains to be seen.

Disclosure: Long LMCK

Note the following excerpt from the earnings call filed with SEC from the earnings call:

And in terms of the strategy?
Gregory B. Maffei
Well, I think we’ve expressed in the past with our actions and our words that we would love to be an owner, 100% of SiriusXM. I think we’ve also expressed in the past with our actions and our words,there’s a limit of what we’re willing to pay for that. And we – our position has gone from being 40.1%– or 40.4% when we struck the transaction back in February and March of 2009 to being 62%-plus today. And time is on our side in terms of eventually, I believe, we’re likely to be the 100% owner at some reasonable price.

Liberty Vivendi Settlement

Vivendi settled with Liberty early this month for $775M for hidings its financial difficulties 13 years ago when negotiating a deal with Liberty. This settlement will result in after tax proceeds of close to $440M for Liberty Media (~4% of market cap). When we had done our thesis on Liberty, we had chalked down this settlement to zero and thought of it as a real option on Liberty Media’s stock. Once in a while, it is fun to see a real option play out. For link on the settlement news, click here

For our prior thesis on Liberty Media, click here