Spent the weekend in Omaha after 12 long years. It was a weekend worth its time. It’s a place to reflect and see the vision of some of the leaders who share openly and give more than they need to . These are not comprehensive notes but some key notes from the different meetings.
Tom Gayner has some interesting nuggets to add during the Markel Brunch:
- On Cyber Insurance: The limits are small and understands the aggregation risks well. Ajit Jain in Berkshire is worried about writing large risks like cloud cyber security where as Markel specializes with much smaller limits and understands aggregation well. Markel is in a different space on cyber insurance compared to Berkshire.
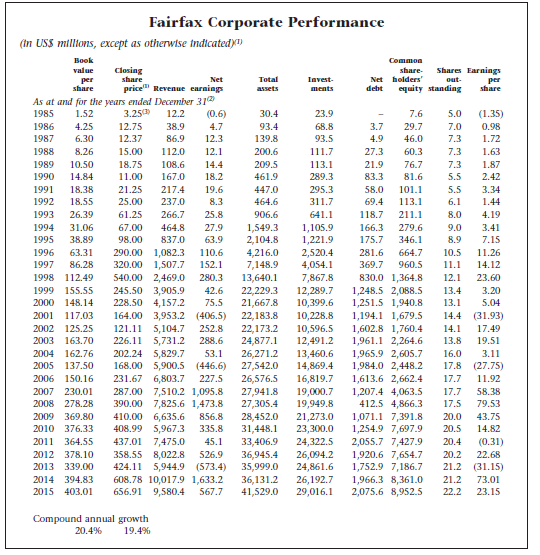
- On Berkshire selling Markel: Learnt about in 13F when it was bought. Thought it was a housekeeping seal of approval. Learnt about it on 13F when it was sold. Does not have any insights on Berkshire’s actions but is buying Markel with his own capital because he thinks its undervalued. Re-iterated a couple of times that Markel is trading much lower than his estimate of intrinsic value. Was pretty open about it.
- Direct question on EBITDA as bullshit earnings: Charlie says what Charlie says. Gave an example of how book value of Coca Cola is $6/share where market price is $60/share. When you buy BRK at 1.5BV, you are essentially buying at $90/share and when you buy MKL that owns BRK at 1.3 or 1.4 times earnings, the value is essentially different as well. The key is to be able to bridge it to cash earnings at the end of the day. Made me think quite a bit about owning Markel and what AAPL earnings yield was on that (through the Berkshire holding) given that AAPL itself is close to 3% annualized earnings yield.
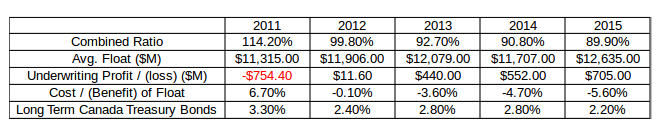
- Combined Ratio: is important but need to see it in combination with how many years have the reserves and estimates of losses been below the estimates. Markel (and Berkshire) are very conservative and have great records.
- The combined ratio discussions got me personally thinking about in this more higher interest rate environment, where the borrowing cost for the US govt is 4-5 pts, we have a business model (both Markel and Berkshire) which earns around 2-4 pts on combined ratio and can borrow at 700-800 bps of spread to the US govt. Even if the portfolio generates the same returns as the S&P 500, the risk levels must be meaningfully lower.
- Vision for Markel: Spent a bit of time talking capital allocation and the vision for Markel with the three engines on Insurance, portfolio and ventures. I think Gayner is set on accelerating the ventures a lot more aggressively and really go after the mini-Berkshire model. We might finally see his stamp in transforming this from a stodgy conservative insurer to a mini-Berkshire. Noted that they would probably not be doing acquisitions that will double their size or so.
Ajit Jain: Was sharp as a tack and came across as very direct, blunt and razor sharp in his thinking.
- Succession: Warren reiterated there cannot be another Ajit. Ajit claims he is building leaders to succeed him when the time comes.
- Cyber insurance: Spoke about the aggregation of risks and issues with writing large deals on cyber insurance like cloud cyber attacks and issues with estimating the losses on them. Reiterated that Berkshire considers that money is lost every time a cyber policy is written.
- Climate Change: All policies are priced yearly. Climate change like inflation will be the friend of the risk bearer provided its priced appropriately.
- Geico: This was probably the most disappointing piece of Ajit’s comments. Reiterated that Geico is still behind, building up infrastructure and will have systems and infra ready by 2025. Warren noted Geico is still the lowest cost player and there is no risk of failing or even losing profitability. It felt as though the entire discussion was defensive in nature. In contrast, Geico in the past has always been heralded as a wonderful company where the moat was widening; the comments made it clear that the moat is shrinking and the management at best has a strategy to catch up.
Greg Abel: Was composed, solid as a rock. Created the right impression that he was the right next leader for Berkshire.
- Management: Leaders are talking to him and more engagement with the operating managers on running the business.
- Pacific Power: reiterated along with Warren that they will not throw good money after that. Separated out good regulatory states like Utah versus Oregon and California. Utah caps economic claims. Oregon lawsuits and claims are adding up but does not think they have much merit. Regulatory reform much chance in the western states.
- BNSF: acknowledged that BNSF had the worst operating ratio of the 5 class 1 carriers. Sounded a lot like the Geico discussion. Felt like the moat was shrinking rather than increasing for the business. There could be two tacts to this: a. Underpromise and overdeliver b. Or the business is indeed losing its widening moat position. Only time will tell.
Tracy Britt Cool: Kanbrick capital. More hands on approach to management and create opportunities in mid size companies using private capital. 5 years as investor in Berkshire, 5 years as operator and now in Kanbrick. Talked about being an investor, operator made her a better capital allocator.
- Pampered Chef: In Berkshire, she served as CEO of Pampered Chef. The business had run down from $700M to $300M in the decade before she stepped in. Made me wonder quite a bit about the decentralized model of Berkshire and how problems remain undetected for so long making tough turnarounds even tougher. Even though Todd Combs is at Geico and BNSF is being worked over, made me think of parallels whether the decentralized ownership led to some for the shrinking of the moats in the two pillars of Berkshire.
- Private Equity: Kanbrick runs as a private equity. It was not clear how the capital structure ensured long term capital because the key pitch was that they invested in things that take time that normal public companies could not or would not have the patience to invest in.
- Kanbrick business system: Has a business system similar to Danahear around Systems, people, operating models and KPIs to enable mid size companies to operate and standardize. Works for most companies except some companies that relied on creative talents.
Warren Buffett: Lots of repeat comments from prior meetings. Few evasive answers. Some average questions from the crowd but Becky’s questions were good. A couple of aww shucks moments when he looked around for Charlie and ended the meeting hoping that he would come back next year.
- Apple Sales: More of them coming? Warren hinted that they would end at $200B at end of Q2 2024. They had $181B at end of Q1. $8-9B from operating earnings leaves them around $10B of potential AAPL sales. A possibility for sure given his comments on APPL.
- Paramount: Owned up that neither Todd or Ted had anything to do with it. Then he made one of those profound statements that Warren makes (remember how he referred to iPhone as the single most important piece of real estate for every human being that the individual treasured) and said it made him think about how people spent their leisure time and how that has changed over time.
- AI: Every reference to AI had a reference to Nuclear weapons. Clear that he sees the risks a lot more deeply than the general population does. Talked about deep fake AI video of him saying things he never uttered. Called scamming a growth industry.
Charlie was missed. Warren Buffett is walking around with a cane. Ajit Jain’s shaking on his hands that I had noticed before was not visible this time around. Tom Garner seems very upbeat about Markel’s prospects.