Manpasand Beverages IPO

Warren Buffett’s words on IPO continue to ring true — “It’s almost a mathematical impossibility to imagine that, out of the thousands of things for sale on a given day, the most attractively priced is the one being sold by a knowledgeable seller (company insiders) to a less-knowledgeable buyer (investors).”

  • 2008-2013 soft drink market has been growing at 20% CAGR
  • The soft drink market is expected to grow at 14% CAGR between 2013 and 2018
  • Mango Sip is a single product contributing to 98% of the sales for the company
  • 17 crores of net debt versus 157 crores of net worth; net debt is pretty low
  • Return on equity for last three years has been 11.9%; 30.4% and 21.9%
  • Net profit declined from 2013 to 2014 by 10% from 22 crores to 20 crores
  • First four months of 2014, the company clocked 15 crores in net profit and 148 crores in sales (against 293 crores preceding 12 months — goosed up before IPO?); 9M 2015 sales is 239 crores and profits are 13 crores;
  • The issue size is for 400 crores, the company has outlined proposals to use up around 270 crores to building a new plant, setting up a new corporate office, drawing down corporate debt etc. and rest to be used for corporate expenses (what does that even mean?)
  • At expected market cap at 1400 crores to 1600 crores based on the IPO price; and expected 12 months trailing earnings at INR 20 crores, we are looking at a trailing PE of 70 to 80;
  • Very aggressive sales growth assumptions are built into the IPO price to justify the valuations

As Warren Buffett mentioned above, we are going to sit aside and watch this company play over the next couple of years.

Links for the weekend — what are we reading?

Hope is not an investing strategy (Safal Niveshak)

Why a few banks are really sweating heading into earnings season (Business Insider)

How to think like Sherlock Holmes (Farnam Street)

Molycorp Inc, files for Chapter 11 Bankruptcy protection (Valuewalk)

Another Ackman merger? Valent said to be in talks with Zoetis (Valuewalk)

Hugh Hendry bet big on Chinese Futures before the selloff (Valuewalk)

The value hunter — Seth Klarman searches for Value in a Sky High Market (Valuewalk)

Bed Bath and Beyond (BBBY)

  • Revenue per share is up $33/share in 2011 to $63/share in 2015
  • ROE is up from 20.85% to 28%
  • Gross Margins are down from 41% to 38%
  • EPS is up from 3.07 to 5.07
  • BBBY has been gobbling up its own shares reducing shares outstanding by 70M shares from 2011 to 2015 reducing shares outstanding from 258M to 188M
  • $6.3B shares re-purchased in last five years
  • Shares are trading at an earnings yield of 7%
  • Company does not give guidance
  • Strong cash position of $875M and net debt of $650M
  • FCF of $4.5B in last five years and $900M in last 12 months
  • Strong management team with share holder orientation

The most important question under the circumstances to ask is: what’s the catch? What can go wrong?

2010 2011 2012 2013 2014
EPS 3.07 4.06 4.56 4.79 5.07
EPS Growth 32.2% 12.3% 5.0% 5.8%
Shares Outstanding 258 244 228 213 189
% Change -5.4% -6.6% -6.6% -11.3%

If you look carefully at the above table, one can spot a potential problem. EPS growth is lower than the rate at which the shares outstanding have been declining. While it is great that the company is returning money back to the shareholders, the underlying business is losing it strength. Over the last 2 years, while shares outstanding have declined 6.6% and 11.3% and net income has risen only 5.0% and 5.8%.

To understand this better, look the below chart to see what happens to EPS when shares outstanding change.

2010 2011 2012 2013 2014
Theoretical shares outstanding 100 94.6 88.4 82.6 73.3
Net Income 100 100 100 100 100
EPS 1.00 1.06 1.13 1.21 1.37
EPS Growth 5.7% 7.0% 7.0% 12.7%

Essentially the underlying EPS growth on the base business has been trending negative for the last 24 months and essentially one is buying a negative EPS growth business goosed up by buybacks at 13 times earnings when one buys BBBY. The primary reason can be attributed to the high gross margins that the company makes at 38% in 2014 as against its chief competition online where it is significantly lower. As the online business for BBBY grows and due to competition, one can expect the underlying EPS to come further down over the next few years. While the strong cash generation and the buyback will probably put a floor on the stock and goose up EPS further, it might be worthwhile to look at it from the sidelines and participate with long term compounding machines instead unless it gets very cheap from here.

Disclosure: No position

Real Estate in India

In today’s markets, value has been tough to find compared to 21 months ago during Sep. 2013 when the pickings were a lot more richer. However, the astute investor does not have to own the markets, he only needs to find one or two investments that have sufficient margin of safety at any given point of time to create value over the long run. 

Traditionally, we have always been a bottoms up investor. While we will continue to make investments bottoms up, we are okay to see if we can identify points of dislocation in the markets by looking top down as well. Today, there are three points of divergence that we can identify with the markets in general. The performance of real estate stocks, the price of oil going down and price of gold over the last decade.

Before we go further, I must confess my view has been and still is that real estate, oil and gold are all commodities. They do not produce any cash flows on their own (small returns for leasing of gold and real estate) except on their sale. Their market value can be perceived to be the opportunity cost of the buyer. From that point of view, one can make an argument whether it is a real asset or not. However, it has been my observation that one can construct business models around commodities that have the ability to create values like housing lending companies, jewellery businesses, real estate construction and REITs.

Today, we will focus on the real estate business. There are three ways an astute investor can participate in the real estate business. Own real estate (land or flats), lend to the real estate sector or own real estate lending companies and owning real estate construction companies. We will talk briefly into all the the three but our primary purpose is to look at option 3 and explore it further in subsequent posts over the next few weeks.

a. Option One — Owning Real Estate — Traditionally preferred by a lot of investors. One feels secure with a roof on the top of one’s head and society does seem to value individuals owning real estate higher than those who don’t (it is an Indian thing). In key cities, rental yields annually are around 2-3% of the purchase cost of the real estate (assuming we have a construction ready real estate) Even if one were living in our own real estate, it does bring costs down by 2-3% of rental costs per year. Also, after tax breaks, it is possible to borrow at 6% and invest in real estate. It is easy to lever and banks are more willing to lend against the brick and motor assets. However, for the small average investor, it does quickly balloons into a big portion of their assets and entrench them that will prevent the investor from exploring alternate more lucrative investments. Secondly, the unlevered returns from the real estate sector is not alluring as it is after leverage. Several studies indicate that most of the real estate returns come through leverage. It must be noted, that if one does intend to lever up, real estate is probably one of the safer ways to lever one’s equity. Thirdly, liquidity and transaction costs of buying and selling means that it is not always possible to move equity to a more lucrative long term investment without costs and time. Fourthly, there is an ongoing maintenance costs that is needed to maintain real estate. Lastly, getting the right certificates, permits, clean documents are always a hassle in the corruption ridden system.

b. Option two — lend to real estate or own housing lending companies — directly lending to real estate transactions can be perilous without the right systems and processes. Owning housing lending companies might be a better option. Quality of the books and management are always a worry here. There are companies like Gruh finance (terribly expensive) have done this successfully creating a viable business model around real estate. Some banks and NBFC’s are also heavily reliant on housing finance. There are two catches here, the good ones are already very expensive and they too depend on leverage to deliver the returns. Leverage is great on the way up and terrible on the way down. However, an average investor can have non-recourse leverage on his balance sheet by owing common equities of housing lending companies at the right prices. We will leave the exploration of this option to a later date.

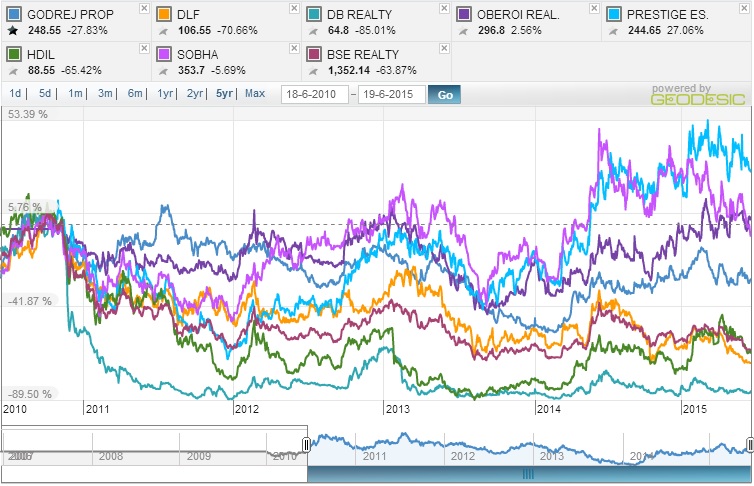
c. Option three — own real estate construction companies — just thinking about this sector brings about a bucket full or risks. Corruption to get permits, murky land deals, bad leverage on the balance sheets, shady managements, intense competition, deals that rip the eye balls of customers etc. the bucket keeps filling up. The real estate index has returned (32)%, (16)% and (64)% in the last 1, 2 and 5 year horizon. It is this big negative numbers that caught our attention. When a sector is this beaten down, the chances are it has also influenced some of the good companies to some extent as well. We do want to wade through this sewer to see if there are any good bets that might work out in the long run.  Below are the charts that show the performance of the bigger real estate companies and the index over these horizons.

1 Yr RE

3 Yr RE

5 Yr RE

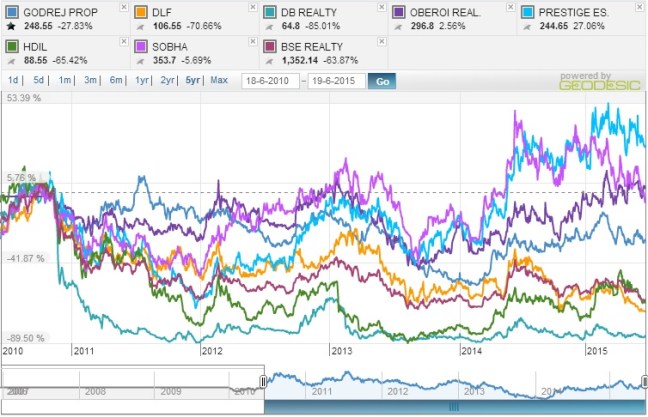
Over the next few weeks, we will be working on publishing a series of posts looking at the risks of investing here and also into the individual companies. If one closely looks at the five year performance of the real estate companies, hardly any value has been created. Investors have been carrying return free risk for 5 years adjusted for inflation. Not a single company has been able to create value as compared to fixed deposits as well over the same time frame. Prestige estates has been one of the better ones (we have not included Ashiana housing that we own as we think it is an outlier) with 27% return over 5 years. We will be looking into some of these companies over the next few posts. What we are looking for is for no debt to very conservative debt, no dilution, robust business models and good managements. If we do not get these characteristics, we will pass on the sector. However, we do intend to pass on companies like DLF, DB Realty and HDIL where a very cursory question rises more questions than answers.

More to follow….

Godrej Properties — Shareholder Value Creation or Owner Value Creation!!!!

Godrej is the second most trusted brand in India. The real estate arm has been executing on a string of exciting projects and been getting on a bigger and bigger treadmill on execution. The company is often touted by investors to grow 10X in the next ten years. The company projects itself having a differentiated, asset light model.

A brief look at the latest shareholder presentation here will reveal all the projects that the company is executing complete with beautiful pictures of the projects being executed like the one seen below.

Godrej

Picture of Godrej Central in Mumbai

A close look at the project pipeline and string of projects that the company is executing leaves in no doubt that the company has got the potential to grow 10X in the next ten years.

The bigger question is how have the shareholders fared during this time?

Godrej_Stock

In the last five years, Godrej Properties has returned (1)% compared to +55% and +56% for Sensex and Nifty. The realty sector has been in a recession and has returned (56)% in the last five years. While the shares have fared better than the BSE realty, it has not created any shareholder value in the last five years. Given that one could have earned 8% on deposits, a shareholders have assumed a return free risk of 46% (8% compounded over 5 years) One might make the argument that the company does not control the share price and lots of investors might have paid a high price for the stock back in five years. So, we will just let the facts rest and move to the next step.

Let us hold the management responsible for capital allocation and ensuring the fundamentals are creating shareholder value for the long run. Like we have seen before here, paying a dear price even for a good asset will risk the returns you get from it.

A look at the shareholders presentation will reveal the following two charts from the management

Godrej Financials

Looks impressive? Until you realize what it took for them to deliver this growth and profit. The below chart shows share outstanding and EPS delivered on the above growth.  While some like to adjust the stocks splits backwards, I have just done this forward.

2010 2011 2012 2013 2014 2015    
  69.85 69.85 78.04 78.05 199.23 199.23 Adjust Adjust 2
          99.615 99.615 Vikhroli Deal 75%
SOUS (mil) 69.85 69.85 78.04 78.05 99.615 99.615 107.985 110.085
SOUS (Crores) 6.985 6.985 7.804 7.805 9.9615 9.9615 107.985 11.0085
N/P (Crores) 122 130 98 138 159 191 191
EPS 17.466 18.6113 12.5577 17.681 15.9615 19.1738 17.35

The company has been diluting shares outstanding at the rate of 9.5% CAGR for the last five years. It is just a staggering number.

One might make the argument that one need to participate in the rights issue and cannot consider it a dilution. If one needs to keep pumping more money just to maintain one’s share, it is share dilution, under any other name like QIP, capital raising, rights etc. This means that the company needs to be growing earnings at 9.5% just to maintain the same level of earnings.  And wait till you hear this, the cost of debt for the company is 11.8% and yes, the debt levels have been going up as well. Short term debt is at 2,700 crores and long term debt at 300 crores at March 2015. The bigger piece of problem is that the inventories have gone up by 1,000 crores between 2014 and 2015 and is now standing at ~4,700 crores.The share holder equity in the company after the repeated capital infusion is 1,850 crores. So, the company has using shareholder money, bank debt and advance money from owners of current projects to bankroll future projects construction and land inventory. So, much for the differentiated asset light model and so much for the growth touted in the presentations.

While a rosy eyed investor can look at the assets of Vikhroli and say that the purchase was a bargain, it was for Godrej Industries and the promoters but not for the minority shareholders. While we do not dispute that the potential of Godrej to grow 10X in the next 10 years, we do share our skepticism on how much actual shareholder value will created in the process.

Disclosure: Own Godrej Properties. Evaluating whether it is a mistake.

ITC’s Use of Cash

ITC has this great cash engine called Tobacco. I dug a little bit into the published 2015 results to see how ITC was using its cash.

There is good news and bad news. Bad news — Cash from Cigarettes which generated ~180%+ ROC is being used to fund FMCG and Hotels business where if the ROC is ~1% in 2015. 90% of the additional capital in ITC went into FMCG or the Hotels business. While one might argue that FMCG will make money in the long run, the hotels choice is a bizarre one as it is cyclical and a low return business. Also, they paid 500 Crores for a property in Goa that is being challenged in the courts right now. Was 2015 an anomaly on how much capital went to hotels or will this be a trend? While one might hope a more prudent allocation in the future, it is something one definitely must be concerned about. Also, a clear road to profitability on FMCG will help as well. Good News — 700 Crores out of the 1,500 Crores that were invested came from other parts of the balance sheet like deferred taxes, better TWC etc. Essentially only 900 Crores or 10% of net profit went into capital for in all FMCG and Hotels. Glass half full or half empty?

All Numbers in Crores INR
ITC Last 12 Month Net Profit 9765
Depreciation 1027
Owners Earnings Before Capex 10792
Dividends 5621
Net of Dividends 5171
Additional Capital Employed % of Capital Employed 2014-2015 ROC of Segments
Capital Employed in Cigarettes 121 8% 183%
Capital Employed in FMCG 632 40% 0.8%
Capital Employed in Hotels 769 48% 1.1%
Capital Employed in Agri -79 -5% 44.1%
Capital Employed in Papers 110 7% 17.0%
Capital Employed in Others 41 3% 32.6%
Total Capital Into Business 1594 31%
Net Capital Left After Investing in Business 3577
Additional Cash in Balance Sheet Compared to 2014 4299 Additional cash coming in from better Deferred Taxes, TWC, Cash Management etc;