Buffett’s Capital Structure and Alpha; Greenlight Re

Lots of work has been done trying to reverse engineer how Buffett managed to build his $350B behemoth. Tons of books discuss about value investing as practiced by Buffett, while some of the smarter ones delve deeper into the insurance operations that Berkshire operated. When we look closely at the insurance operations, some of the key advantages of this structure are:

  • Float generated by insurance offers good amount of leverage for the portfolio that Buffett manages
  • Cost of float has been less than zero; Buffett gets paid to manage the float; (see below table) Buffett can borrow cheaper than the U.S. government.
  • Float is not directly connected to the markets but to events; the debt will not disappear overnight or cannot be called overnight and hence almost non-recourse
  • As long as the insurance companies continues operations, a significant piece of this float will be available for long time (almost permanent capital)
  • Insurance operations are exempt from the investment act of 1940 which place restrictions on operations; Berkshire could not have intervened in Geico, Salmon, special situations or own whole public companies; Berkshire would have been regulated as a mutual fund
  • Insurance operations can buy whole public companies

.Table from: Paper on Buffett’s Alpha (here)

Cost of Float

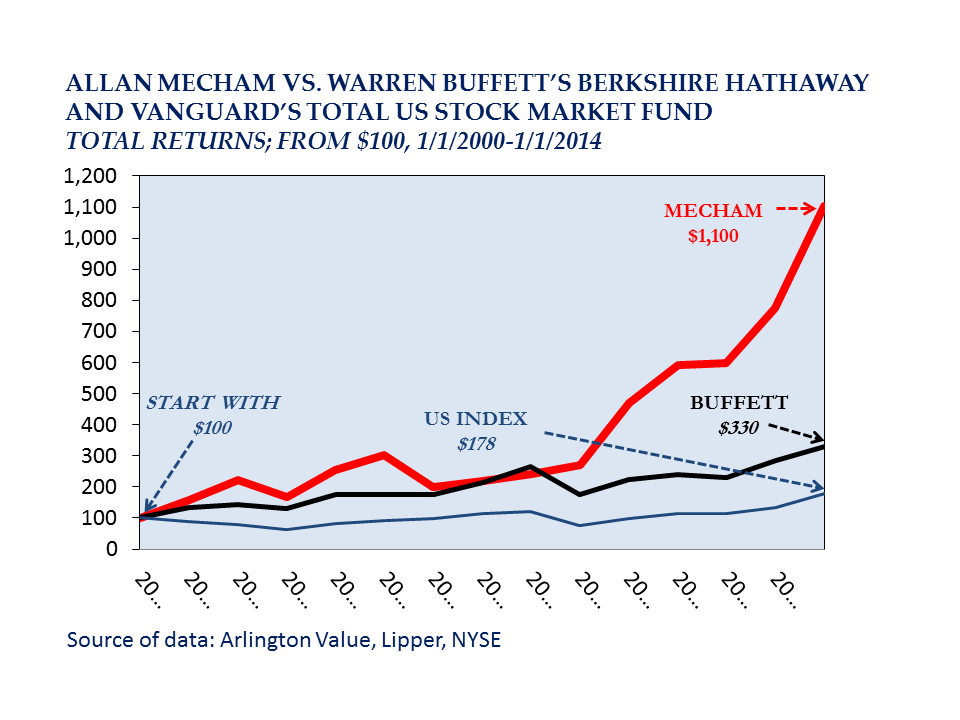
So, float provided a cheap source of leverage and (almost) permanent capital. What would Berkshire look like if Buffett had invested in S&P 500 instead of handpicking companies? Joseph Taussig of Taussig capital did do the work and reverse engineered the investments.

S&P grew 9.7% CAGR for 40 years between 1969 and 2009. Warren Buffett’s investments grew at 12.4% CAGR.  If one had taken the taken all the money (close to $70M when Warren Buffett assumed Berkshire in 1969) and put it in S&P 500, one would have $2.5B and with Warren Buffett’s stock picks, one would have $4.3B. Around 2009, Berkshire’s market cap was about $150B. Why the difference? The study from Taussig capital does a great job of explaining this difference in simple terms,  for every $ of equity capital, Buffett used 2$ of reserves, with 12% return on investments, Buffett earned 12% of equity plus 2 times 12% on reserves = 36% net of 4% cost of float (2% for every 1$ of leverage / reserves) and ended with a ROE of 32%. Since Berkshire is domiciled in the US, it has to pay taxes, and the post tax returns are 20% CAGR which takes us close to $150B. The difference between $4.3B and $150B (in 2010) came from the insurance structure.

So, a huge piece of the returns came for Berkshire because of the capital structure than from the investing alpha that Buffett created. Warren Buffett did pick the right insurance companies to buy which mattered a lot. Buffett’s big alpha were from picking the right insurance vehicles that have created the massive conglomerate. As long as the insurance operations do fine and returns on incremental investments is decent, Berkshire will do fine in the future as well.

How does an investor starting today structure an operations with a capital structure better than Berkshire? Remember that Buffett also defers taxes by not selling securities and compounding the float from the taxman. Also note that the ROE’s came down from 32% to 20% because of taxes.

Enter David Einhorn and Greenlight Re. David Einhorn started a re-insurer based in Bermuda (which is tax free) and re-directs all the cash to Greenlight capital to invest which creates better economics than Berkshire does. Although, as Warren often points, insurance as an industry runs at a net loss through the cycle. Greenlight Re has been struggling to keep the combined ratio low and there are additional headwinds for a shareholder. Einhorn charges 2% management fee and 20% of profits of every year (with watermark). It is a very lucrative deal for David Einhorn. With earned premiums close to 50% of capital, the portfolio is levered at 0.5X. If S&P returns 10% and David Einhorn invests to meet the market returns of 10%. With the leverage, it will be 15% minus the  2% management fee and 20% incentive fee, it will be worth 10%.  The effects of leverage are being eaten up by Einhorn and not flowing to the shareholders. However, if the unearned premium does go up, it might present interesting possibilities as he has returned 18.9% CAGR on investments in Greenlight Capital since inception in 1996. Einhorn’s ability to create alpha plus the fact that the stock is trading at a discount to book value offers additional possibilities if the unearned premiums go up.

For now, we are content just monitoring Greenlight Re and Third Point Re (Daniel Loeb’s version of the same structure) and watch it for more time.

Current Portfolio of Allan Mecham (Dataroma)

The current portfolio of Allan Mecham as of 31st March, 2015 (From DataRoma)

Stock
% of portfolio Shares Recent activity
hist BAC – Bank of America Corp. 14.35 6,453,725 Add 9.00% $15.39
hist CMPR – Cimpress N.V. 14.02 1,150,329 Add 5.39% $84.38
hist DNOW – NOW Inc. 12.70 4,061,596 Add 123.99% $21.64
hist SNE – Sony Corp. 11.64 3,009,375 Add 2.68% $26.78
hist OUTR – Outerwall Inc. 9.88 1,034,260 Add 5.68% $66.12
hist LUK – Leucadia National Corp. 8.39 2,604,158 Add 8.44% $22.29
hist IBKR – Interactive Brokers Group Inc. 8.30 1,688,495 Add 32.42% $34.02
hist Y – Alleghany Corp. 6.40 91,001 Add 8.83% $486.99
hist MSM – MSC Industrial Direct 4.83 462,853 Buy $72.20
hist CHEF – The Chefs’ Warehouse 4.13 1,274,374 Reduce 6.17% $22.43
hist BRK.B – Berkshire Hathaway CL B 3.43 164,318 Add 13.50% $144.32
hist BRK.A – Berkshire Hathaway CL A 1.35 43 Reduce 2.27% $217511.63
hist CPRT – Copart Inc. 0.51 93,357 Add 9.52% $37.57
hist HEI – HEICO Corp. 0.05 6,611 Buy $49.61
hist DSWL – Deswell Industries 0.03 100,981 $1.84

Allan Mecham — Links of interest

Came across a few articles of Allan Mecham from Arlington Capital who has been beating the pants out of S&P 500 since 1999. He does not use spreadsheets or any models, he just sits, reads and thinks. While we have not seen the audited performance, it does seem like that certain audits were carried out and it was kosher. Sharing a few links to read more about this guy. It makes an interesting read.

MECHAM

Is this the next Warren Buffett? (Forbes & Forbes)

The 400% man (MarketWatch)

The 400% man – A lesson for aspiring investors (BaseHitInvesting)

Musings on the 400% man (Alephblog)

Interview with Allan Mecham (ManualOfIdeas)

Allan Mecham — The Early Years (ValueWalk)

Allan Mecham 2014 Letter (Valuewalk)

Allan Mecham on the Bull Case for Sony and Alleghany (Valuewalk)

Allan Mecham Unloads Berkshire and Loads Up Outerwall (Valuewalk)

Allan Mecham a Businesslike approach to Investing like Ben Graham (Valuewalk)

Shriram Transport Finance — Annual Letter Analysis

When STFC had released their annual results and the Q4 numbers, I had written the following post after looking at the provisions for the Shriram Equipment Finance division. Now, their annual report was released and as with most longs I have, I did read through the report over the weekend.

In 2015 compared to 2014, NIM on AUM remained very strong at 6.61% versus 6.68% prior year. Despite the additional INR 325 crores of provisions in 2015 in the Shriram’s equipment subsidiary, and the total provisions increasing by 28% to 1,612 crores from 1,213 Crores in 2014, the company reported net profits north of INR 1,000 crores.  On the balance sheet, there is still INR ~1,800 Crores already provisioned waiting for assets to go bad and paid out.

Interesting was how little the subject of write off in the equipment business got a mention in the main annual report of STFC.

The total AUM is up to 62K Crores from 52K Crores.  Diluted EPS is down to INR 45 from 59 in 2014. The company earned 1,022 Crores in 2015 compared to 1,357 in 2014. Rest of the things were boilerplate with the expected recovery in the economy and the commercial vehicle market expected to drive higher earnings but it does look like the long term story does look intact.

The one thing that caught my eye was note 22 in the annual report.

Provisions

For the company to start losing money or book value to start going backwards close to 2,600 crores or close 4.5% of its book must go bad at the same time every year. Even after that, the company has sufficient reserves and a high CAR to take pain for a while before it would start bleeding bad. Assuming that the company has taken the bloodbath in the equipment finance arm, one can expect to see some improvement in the consolidated EPS but looks like recovery in the economy might be a while away and the company might continue to struggle on the NPA’s on the main transport finance business.

As we have iterated in the past, a good economic moat surrounds the business, with a management that is conservative and has demonstrated integrity in the past, though in a cyclical business. The long term story does seem to remain intact.

Disclosure: Long STFC

What are we reading?

Email Communication between Muthu and Prof. Bakshi (WiseWealthAdvisors)

Hedge Fund Due Diligence Uncovers Serious Questions (ValueWalk)

How Warren Buffett Calculated ROE (ValueResearchOnLine)

Deutsche Bank: An inside look at Former CEO’s role in LiborGate (ZeroHedge)

Why Microsoft’s Windows 10 Upgrade is bad news for Intel (BusinessInsider)

Piramal Enterprises Annual Letter

It is that time of the year when most of the companies release their annual reports for the fiscal year 2014-15. We started the season by reading through Piramal Enterprises annual letter. By and large, it was boilerplate, which by itself is not bad.

The letter did touch upon the long term value creation that the company has created. 24% CAGR on sales over 27 years and EBITDA of 26% CAGR over the same period. The sales mix over the last few years were discussed. Ajay Piramal indicated that they considered the three distinct segments as three different companies in healthcare, financial services and information management.

One of the interesting exhibits was the profit bridge between 2014 and 2015.

Bridge

The interesting piece in  this bridge is the first half where one can see that the marginal sales of INR 301 + 211 + 120 crores of 632 Crores in 2015 generated operating profit of 246 Crores which is north of 35% OP which is great. The de-leveraging that Piramal has undertaken by paying down debt with the proceeds of the Vodafone investment is evident and it will result in better bottom line in the future years. That is just about the only interesting thing in the annual report. The rest of the report is noticeable for the questions it did not answer than what it did.

Let us look at the 2015 results from the consolidated results published.

Segment

 Let us take a closer look at Pharma. The 2015 results include the NCE write-offs. So, let us exclude that and look at the segment profits.

Pharma in Crores 2014 2015
Sales 2877 3165
Segment Profits -162 -497
Profits Excluding NCE write-off -165 -198
% -5.7% -6.3%

a. The annual report is very descriptive and talks about the revenue growth. What about the operating profits of the Pharma segment? The annual report does not allude what the company was doing to improve the profits of the segment which contributed to ~60% of the sales and losing money?

b. A lucid MD&A must talk about what steps the company can take to rationalize the operations to make it profitable. What is the real true worth of the Pharma business where the operating margin continues to trend south?

Moving on to the financial services.

Financial services

The company does a great job of explaining where the sources of revenue and how it is growing. However, the following questions do remain

a. What is the leverage ratio of the financial arm? (Which I do not think is much? If you take out the DRG portion of the debt (which I think is the USD denominated debt), very little is left behind

b. What is the CAR for this arm?

c. What is the GNPA and NPA for this segment?

d. What is the plan with respect to the long run on how we plan to continue to fund the business?

Granted that Ajay Piramal is a master capital allocator but I do think the shareholders deserve to know the risks they are taking on when they hold Piramal shares. While Piramal continues to think of the three segments as three different companies, the annual report does not provide the required clarity easily to the shareholders to understand the risk of the three segments.

Make no mistake, Ajay Piramal has done wonders in the past and does not owe any answers to analysts but I do think the half minority owners do deserve to know on the key metrics that drive the firm in the long run.

Disclosure: Long Piramal