It is that time of the year when most of the companies release their annual reports for the fiscal year 2014-15. We started the season by reading through Piramal Enterprises annual letter. By and large, it was boilerplate, which by itself is not bad.
The letter did touch upon the long term value creation that the company has created. 24% CAGR on sales over 27 years and EBITDA of 26% CAGR over the same period. The sales mix over the last few years were discussed. Ajay Piramal indicated that they considered the three distinct segments as three different companies in healthcare, financial services and information management.
One of the interesting exhibits was the profit bridge between 2014 and 2015.
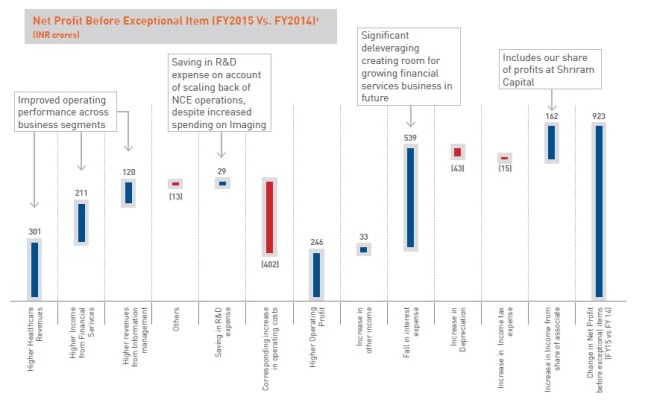
The interesting piece in this bridge is the first half where one can see that the marginal sales of INR 301 + 211 + 120 crores of 632 Crores in 2015 generated operating profit of 246 Crores which is north of 35% OP which is great. The de-leveraging that Piramal has undertaken by paying down debt with the proceeds of the Vodafone investment is evident and it will result in better bottom line in the future years. That is just about the only interesting thing in the annual report. The rest of the report is noticeable for the questions it did not answer than what it did.
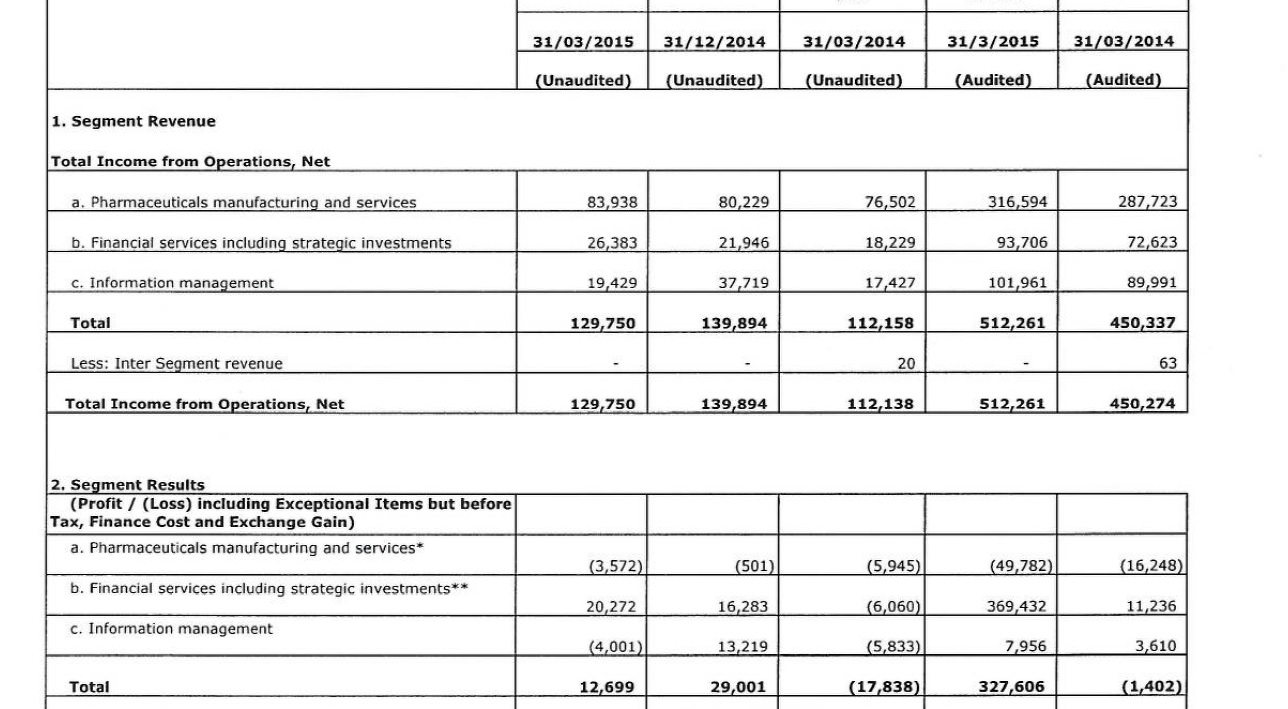
Let us look at the 2015 results from the consolidated results published.

Let us take a closer look at Pharma. The 2015 results include the NCE write-offs. So, let us exclude that and look at the segment profits.
| Pharma in Crores |
2014 |
2015 |
| Sales |
2877 |
3165 |
| Segment Profits |
-162 |
-497 |
| Profits Excluding NCE write-off |
-165 |
-198 |
| % |
-5.7% |
-6.3% |
a. The annual report is very descriptive and talks about the revenue growth. What about the operating profits of the Pharma segment? The annual report does not allude what the company was doing to improve the profits of the segment which contributed to ~60% of the sales and losing money?
b. A lucid MD&A must talk about what steps the company can take to rationalize the operations to make it profitable. What is the real true worth of the Pharma business where the operating margin continues to trend south?
Moving on to the financial services.
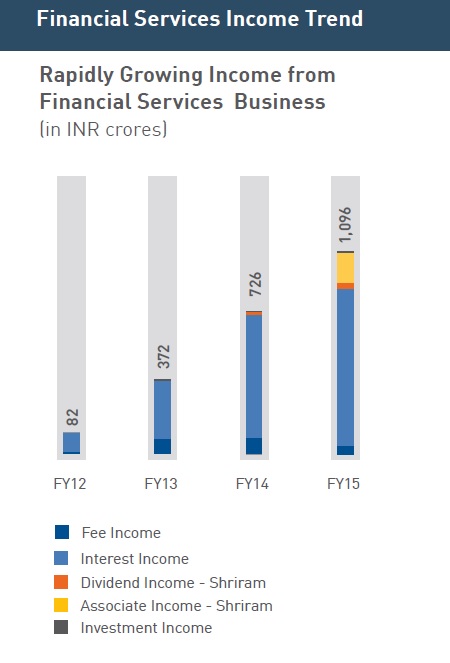
The company does a great job of explaining where the sources of revenue and how it is growing. However, the following questions do remain
a. What is the leverage ratio of the financial arm? (Which I do not think is much? If you take out the DRG portion of the debt (which I think is the USD denominated debt), very little is left behind
b. What is the CAR for this arm?
c. What is the GNPA and NPA for this segment?
d. What is the plan with respect to the long run on how we plan to continue to fund the business?
Granted that Ajay Piramal is a master capital allocator but I do think the shareholders deserve to know the risks they are taking on when they hold Piramal shares. While Piramal continues to think of the three segments as three different companies, the annual report does not provide the required clarity easily to the shareholders to understand the risk of the three segments.
Make no mistake, Ajay Piramal has done wonders in the past and does not owe any answers to analysts but I do think the half minority owners do deserve to know on the key metrics that drive the firm in the long run.
Disclosure: Long Piramal