As per DNB’s 10-K (2014)
The Dun & Bradstreet Corporation is the world’s leading source of commercial data, analytics and insight on businesses. Our global commercial database as of December 31, 2014 contained more than 240 million business records. We transform commercial data into valuable insight which is the foundation of our global solutions that customers rely on to make critical business decisions.
- DNB has a market cap of $4.5B
- Trailing PE of 18.5
- Revenue has grown from $33.2/share in 2010 to 45.8/share in 2014
- EPS has gone up from 4.99/share to 7.09/share
- DNB has negative equity and ROE is infinity
- Very strong GP margins with 66.8% which has remained flat over the last four years
- Net margin has expanded from 15.5% in 2010 to 17% in 2014
- LT debt to total assets has gone up from 0.5 to 0.7
- Shares outstanding is down from 50 million shares in 2010 to 36.4 shares in 2014
- FCF has remained flat around the $250M/year mark for the last four years
Below table shows the underlying EPS change adjusted for buybacks.
| 2010 | 2011 | 2012 | 2013 | 2014 | |
| Shares Outstanding | 50.4 | 49.3 | 46 | 39.5 | 36.9 |
| -2.2% | -6.7% | -14.1% | -6.6% | ||
| Theoretical Net Income | 50.4 | 50.4 | 50.4 | 50.4 | 50.4 |
| EPS | 1 | 1.02 | 1.10 | 1.28 | 1.37 |
| Actual Net Income | 252 | 260 | 296 | 259 | 294 |
| EPS | 5.0 | 5.3 | 6.4 | 6.6 | 8.0 |
| EPS change | 5.5% | 22.0% | 1.9% | 21.5% | |
| Underlying EPS change | 3.2% | 13.8% | -12.5% | 13.5% |
The underlying business shows strong improvements in the underlying EPS except for 2013.
This is a very interesting case where so far we have seen shows a very strong underlying business. It is almost a Warren Buffett type of company.
Let’s look at the entire business from another perspective
| $M | 2010 | 2011 | 2012 | 2013 | 2014 | 4 Year CAGR |
| Revenue | 1677 | 1759 | 1663 | 1665 | 1682 | 0.1% |
| Gross Profit | 1119 | 1171 | 1142 | 1105 | 1112 | -0.2% |
| Operating Profit | 409 | 425 | 432 | 437 | 422 | 0.8% |
| Net Income | 252 | 260 | 296 | 259 | 294 | 3.9% |
So, revenue, gross profits and operating profits have not moved at all in the last four years so where is all the underlying EPS change coming from?
| % | 2010 | 2011 | 2012 | 2013 | 2014 |
| Tax Rate | 35.55 | 29.67 | 21.97 | 34.22 | 15.09 |
2013 EPS was -ve when DNB paid a full tax rate and 2014 EPS growth was all driven by lower tax provisions. So, what is driving this different tax rate? In page 140 of the 2014 annual report is the answer.
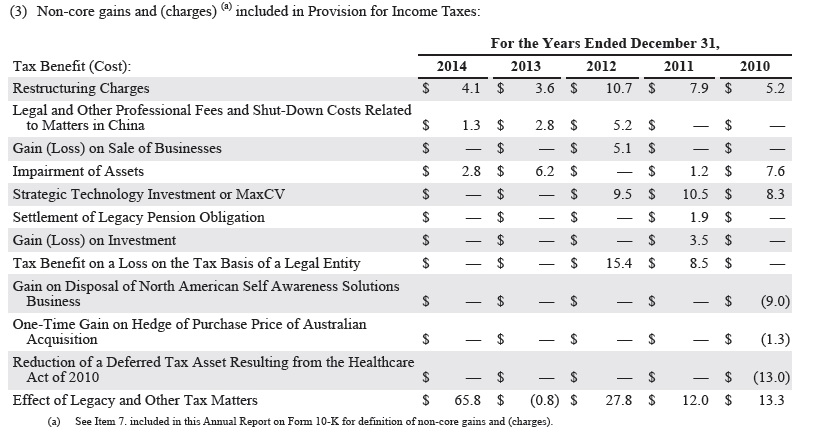
in 2013, when the company had no tax benefits from restructuring or legacy tax matters, the tax rate was full 35%. The underlying EPS change was (12.5)%. There was a $66M legacy tax in 2014 without which might not be available in 2015 and forward. So, what was driving the $66M legacy tax benefit?


It definitely looks like a non-recurring tax benefit. The company does however comments that it might benefit from more sales into lower tax states but does not quantify the same. Can a conservative investor count on tax benefits to help drive free cash flow in the future?
A zero sales growth, negligible operating profit growth and free cash flow growth company is trading at 19 times earnings in the US… With competition intensifying from low cost search aggregators and a changing landscape in technology services, Investing in DNB today does look like a very speculative bet. While the underlying business drives strong ROE and has great products, a shareholder investing in the common might not see the benefits of the same in the long run.
Disclosure: No position
